

What is a stochastic optical reconstruction microscope STORM?
What applications does it have?
The Golgi transport network (TGN) and nuclear endosomes are important protein sorting stations in the secretory transport pathway. Protein sorting is essentially a process of spatial isolation, but in mammalian cells, the spatial relationships between the proteins that make up the sorting mechanism have not been systematically analyzed at high resolution. Here, with the help of STORM imaging, the authors show that TGN/endosomal localized cargo adapters AP-1, GGA2, and epsinR form elongated structures longer than 250 nanometers in the near-nuclear Golgi region. The authors' data show that the cargo adapters of TGN/endosomal localization have obvious spatial relationships. Spatially separated cargo adapters GGA2 and AP-1 regulate sorting of Frizzled6 and Vangl2, respectively, and spatially related cargo adapters can collaboratively regulate specific sorting processes.
NO.1 Introduction to the study (excerpt)
NO.2 Research results (excerpt)
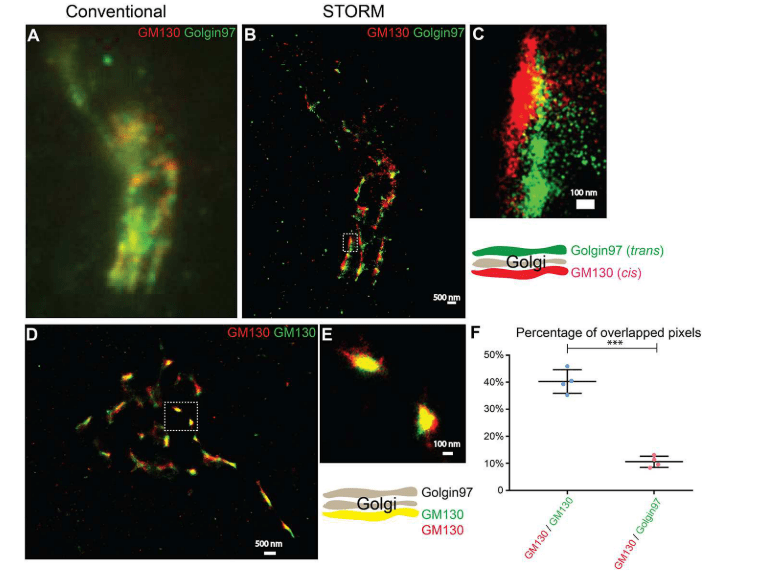
(A, B) Localization patterns of cis-Golgi labeling (GM130) and trans-Golgi labeling (Golgi-97) in the same COS7 cells visualized by conventional fluorescence microscopy (A) or by STORM(B). Scale bar, 500 nm. Enlarged view of the area shown in (C)(B). Scale bar, 100 nm. (D) The STORM technique reveals the localization pattern of two different fluorescent dye-labeled cis-Golgi markers (GM130) in COS7 cells. Scale bar, 500 nm. Enlarged view of the area shown in (E)(D). Scale bar, 100 nm. (F) Quantify the percentage of overlapping pixels (mean ± SD) between GM130 and Golgin-97 and between the Alexa Fluor 750-labeled GM130 and Alexa Fluor 647-labeled GM130 based on four super-resolution images obtained from one experiment in each experimental group. * ** p〈0.001, using the two-tailed Student t-test. Super-resolution images show localization patterns of the indicated protein throughout the paranuclear region. Each point in the plot represents data for the entire near-nuclear Gorgi zone of each single cell.
Using STORM, the authors sought to analyze the spatial relationship between clathrin and cargo adaptors in COS7 cells. The authors selected the entire near-nuclear Gorky zone in which most cargo adapters are located for the following super-resolution imaging analysis. This analysis showed that STORM could detect the circular localization of clathrin around the vesicle shell.
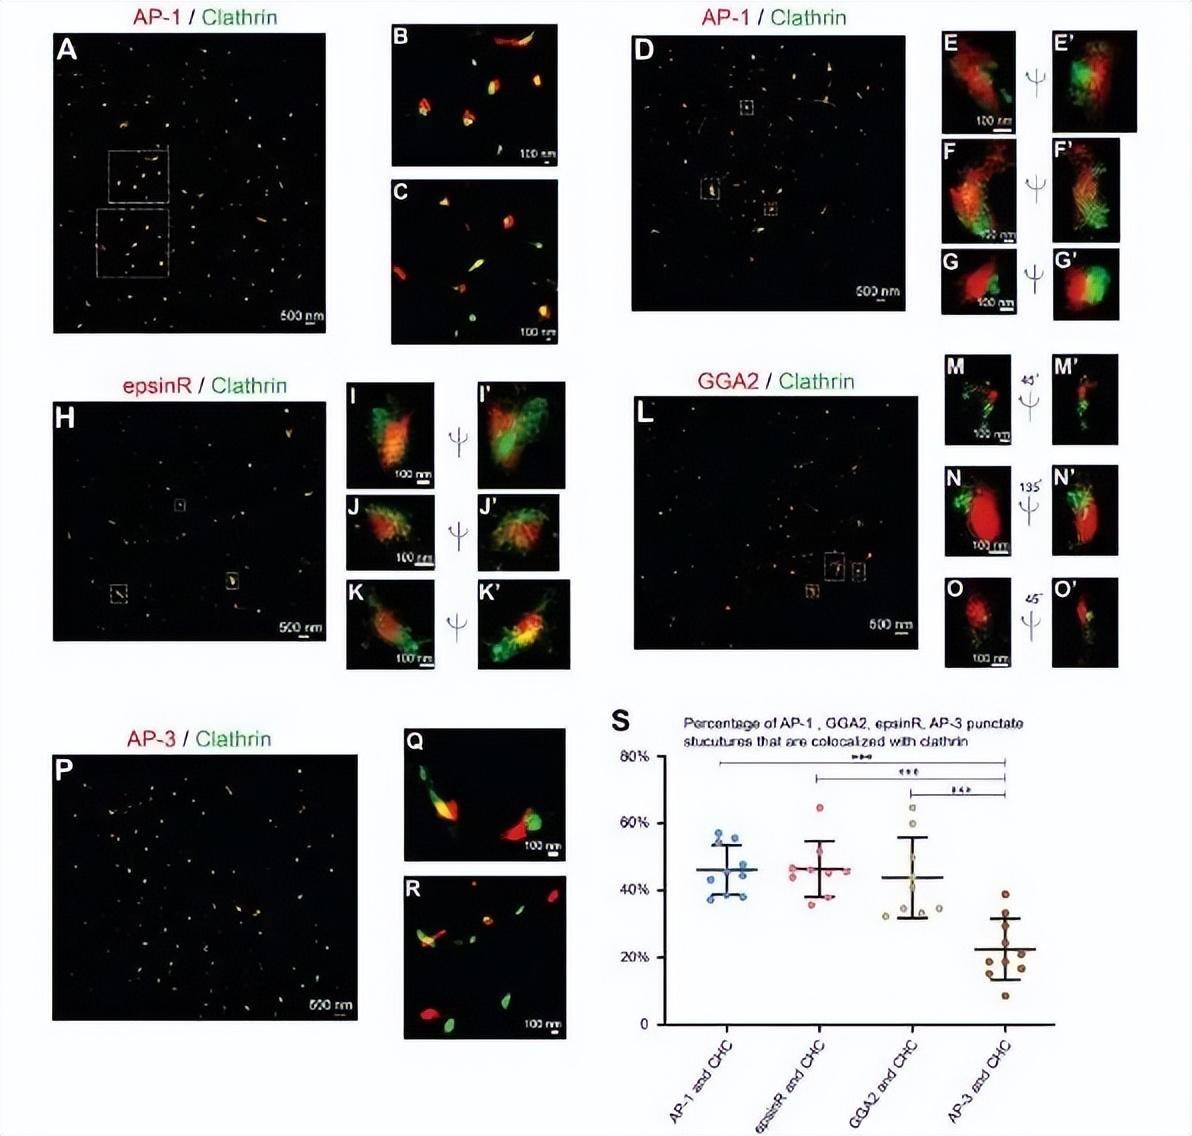 Fig. 2 Spatial relationship analysis of cargo adaptor and clathrin in the near nuclear region
(A-G co-stain COS7 cells with anti-clathrin heavy chains and antibodies γ 1-adaptin.) The two-dimensional (A-C) and three-dimensional (D-G") localization patterns of γ 1-adaptin-labeled AP-1 and clathrin heavy-chain tagged clathrin in COS7 cells were analyzed using STORM technology. An enlarged view of the indicated area in (A,D) is shown in (B, C) and (E-G), respectively. (H-K'). Transfection of COS7 cells with epsinR-FLAG. On day 1 post-transfection, cells are co-stained with anti-γ 1-adaptin antibody and FLAG tag. STORM analyzes the spatial localization patterns of epsinR-FLAG and clathrin heavy chains in the same COS7 cell. An enlarged view of the area specified in (H) is shown in (I-K"). (L-O co-stain COS7 cells with anti-clathrin heavy chain and GGA2 antibodies.) The STORM technique analyzes the three-dimensional localization pattern of GGA2 and clathrin heavy chains in the same COS7 cells. An enlarged view of the specified area in (L) is shown in (M-O"). (P-R) COS7 cells are co-stained with antibodies to anti-clathrin heavy chains and AP3 δ 1. Application of STORM to analyze the two-dimensional localization patterns of AP3 δ 1 and clathrin heavy-chain tagged AP-3 in COS7 cells. An enlarged view of the area shown in Figure P is shown in (Q,R). (S) Quantification of AP-1, GGA2, AP-3, or epsinR spot components associated with clathrin (mean ± SD, based on ≥ 9 super-resolution images) based on 3 independently replicate acquisitions of super-resolution images for each experimental group. Super-resolution images show localization patterns of the indicated protein throughout the near-nuclear region, where most cargo adaptors are localized. Each point in the plot represents data for the entire near-nuclear Gorgi zone of each single cell.
2. Analysis of cargo articulation subspatial relationship of TGN/endosome positioning
Next, the authors analyze the spatial relationship between TGN and endosomal localized cargo adapters at fine resolution.
Superresolution imaging analysis of AP-1 and epsinR revealed that some epsinR structures are associated with AP-1 structures (Figure 3E-H, and quantification in Figure 3I) and some AP-1 and epsinR structures are separated from each other (Figure 3E, G).
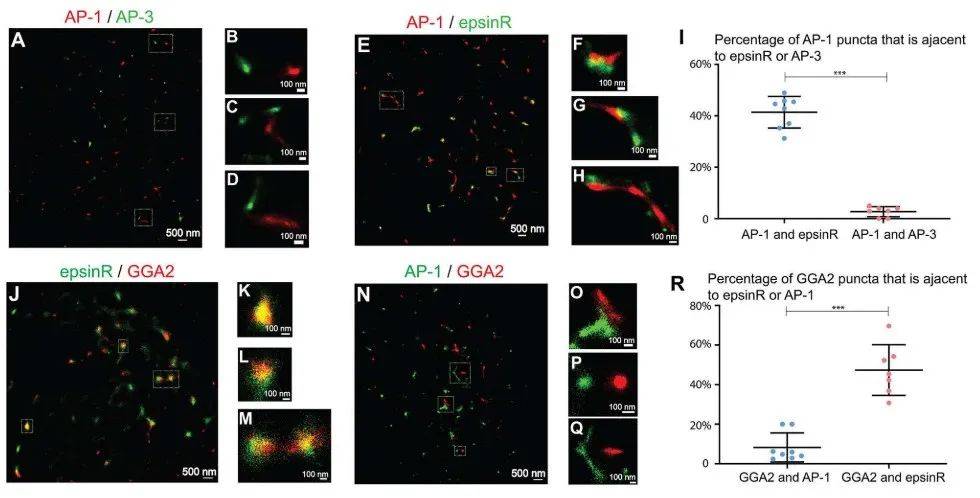 Fig. 3 Spatial relationship analysis of clathrin adapters in the near nuclear region
(A-D,N-Q)COS 7 cells are costained with γ1-adaptin and δ3-adaptin antibodies or with γ1-adaptin and GGA 2 antibodies. STORM is then used to visualize the positioning of AP-1 and AP-3 (A-D) and the positioning of AP-1 and GGA 2 (N-Q). (E-H,J-M)。 Transfect COS 7 cells with epsinR-FLAG. On day 1 post-transfection, cells are co-stained with antibodies against gamma 1-adaptin and FLAG tags (E-H) or anti-GGA 2 and FLAG-tagged antibodies (J-M). The localization of γ1 and epsinR-FLAG and the localization of GGA 2 and epsinR-FLAG were then visualized using STORM. A magnified view of the specified area in (A, E, J, N) is shown in (B-D, F-H, K-M, O-Q). The scale bar for each panel is shown. (I,R) Quantify the percentage of AP-1 spots associated with epsinR or AP-3 (I) and the percent of the GGA 2 spots associated with epsinR or AP-1 (mean ± SD, based on ≥ 7 super-resolution images). p〈0.001, using the two-tailed Student t-test. AP-1 and AP-3 are labeled with anti-γ1 and δ3 antibodies, respectively. Super-resolution images show localization patterns of the indicated protein throughout the near-nuclear region, where most cargo adaptors are localized. Each point in the plot represents data for the entire near-nuclear Gorgi zone of each single cell. Quantitative analysis is based on super-resolution images obtained from three independent replicates for each experimental group.
3. Visualize the sorting of planar cell polar proteins Vangl2 and Frizzled6 as TGN leaves by super-resolution imaging analysis
The authors selected most of the near-nuclear regions localized by Vangl2 for super-resolution imaging analysis. STORM imaging analysis showed that most Vangl2 Y279A and Y280A punctate structures were not adjacent to AP-1 (Figure 4J, U). Next, the author tried to observe these sorting processes with STORM.
 Figure 4 Classification visualization of Vangl2 and Frizzled6 when exiting TGN via STORM
(A-H transfects COS7 cells with HA-Vangl2 (wt). On day 1 after transfection, cells are incubated at 20 °C for 2 h and then at 32 °C for 5 min. After incubation, observe the localization of Vangl2 (wt) and AP-1 γ subunits in two dimensions (A-D) and three dimensions (E-H) with STORM. An enlarged view of the indicated area in (A) is shown in (B-D). An enlarged view of the indicated area in (E) is shown in (F-H). The 180° rotation view of (F-H) is shown in (F'-H'). The scale bar for each image is shown. (I-K) Transfection of COS7 cells with HA-Vangl2 (wt) or HA-Vangl2 Y279A, Y280A, or HA-Frizzled6. On day 1 after transfection, cells are incubated at 20 °C for 2 h and then at 32 °C for 5 min. After incubation, the localization of Vangl2 (wt) and AP-3 δ subunits (I), Vangl2 Y279A, Y280A and AP-1 γ subunits (J), Frizzled6 and AP-1 γ subunits (K) were observed with STORM. Scale bar, 500 nm. (L-Q) COS7 cells were transfected with HA-Vangl2 (L) or HA-Frizzled6 (M-P) or co-transfected with epsinR-FLAG and HA-Frizzled6 (Q-T). On day 1 after transfection, cells are incubated at 20 °C for 2 h and then at 32 °C for 5 min. After incubation, bicolor STORM was used to visualize the localization of Vangl2 and GGA2 (L), Frizzled6 and GGA2 (M-P), or epsinR-FLAG and Frizzled6(Q). An enlarged view of the indicated area in (M,Q) is shown in (N-P,R-T). (U) Quantitative | adapter for the percentage of Vangl2 or Frizzled6 spots associated with the specified cargo (mean ± SD, based on ≥ 6 super-resolution images per experimental group). * * p〈0.01,*** p〈0.001, using the two-tailed Student t-test. Super-resolution images show localization patterns of the indicated protein throughout the near-nuclear region, where most cargo adaptors are localized. Each point in the plot represents data for the entire near-nuclear Gorgi zone of each single cell. Quantitative analysis is based on super-resolution images obtained from three independent replicates for each experimental group. (v) The proposed model shows that AP-1, AP-3, epsinR, and GGA2 assemble into elongated structures with different spatial relationships on different microdomains on TGN and endosomal membranes: spatially separated GGA2 and AP-1 regulate the sorting of Frizzled6 and Vangl2, respectively; The space-related cargo adapters GGA2 and epsinR jointly regulate the sorting of Frizzled6.
NO.3 Research Discussion (Excerpt)
About us
Ningbo Lixian Intelligent Technology Co., Ltd. (IN At the end of the article, you can book an ultra-high resolution microscopy imaging system iSTORM test shot!) VIEW) is a scientific and technological enterprise specializing in ultra-high-resolution microscopy technology and product research and development, relying on the automatic control, a new generation of information technology of Fudan University and the biology, optics, image processing and other technologies of the Hong Kong University of Science and Technology, with optics, biology, automatic control, machinery, information technology and other interdisciplinary technical teams, the 2014 Nobel Prize in Chemistry technology industrialization, launched a series of products such as ultra-high-resolution microscopic imaging system iSTORM, cell intelligent monitoring assistant Celest, etc. Help people see the microscopic world from an unprecedented perspective, push the limits, and see things like never before.