

01Research background
Telomeres are protective structures located at the ends of chromosomes, tandem repeating DNA sequences consisting of (TTAGGG)n and a mixture of related proteins in mammals. Telomeres play an important role in protecting chromosomes from degradation, activating replication senescence, and regulating gene expression in many cellular processes.
In somatic cells, telomere deprotection triggers DNA damage responses and telomere-mediated repetitive aging, which can be seen as intrinsic processes that prevent the proliferation of normal aging cells. Telomeres can also lead to the depletion of stem cells and the loss of healthy cell renewal, tissue regeneration defects, decreased tissue function, and accumulation of senescent cells. The accumulation of senescent cells in tissues is thought to be the main cause of long-term chronic inflammation and age-related diseases, including cancer. Biological age is a major predictor of the incidence of many chronic diseases. During normal cellular aging, the loss of telomere integrity also triggers DNA damage signals, ultimately leading to the aging phenotype.
Fluorescence microscopy helps researchers study telomere dynamics, shape, localization, and codistribution of proteins. Microscopic tools to study these structures have now been developed to investigate the molecular mechanisms that affect telomeres. Using human fibroblasts as an example, the authors utilized multiple microscopes, as well as two super-resolution techniques, three-dimensional structured illumination microscopy (3D-SIM) and direct stochastic optical reconstruction microscopy (dSTORM), to study several features of telomeres. In this article, the benefits of direct stochastic optical reconstruction microscopy (dSTORM) for telomere studies are highlighted.
02Research Introduction (Excerpt)
telomere visualization
A deep understanding of the pathways and proteins involved in maintaining telomere integrity is critical to improving cell longevity and delaying the onset of age-related diseases. Telomere DNA was first observed by fluorescence microscopy about 25 years ago, but the resolution of microscopy had yet to be improved. About 150 years ago, Ernst Abbe first described the resolution limit, which is defined as the shortest distance between two objects (at this distance, they can be distinguished into two separate entities). For far-field fluorescence microscopy, the optical resolution is determined by the wavelength of light and the numerical aperture of the objective.
In addition, the contrast between cell features and background can reduce the resolution of the image, requiring researchers to use bright probes. While contrast in the sample is usually not the only factor in fluorescence microscopy, resolution is physically limited by the diffraction of light with lateral (X, Y) resolution of 200-250 nm and axial (Z) resolution of 500-700 nm. In order to break through the diffraction limit, which requires a transverse, axial or simultaneous increase in resolution of two times or more, various techniques have been developed.
One of the preferred techniques for visualizing, analyzing, and quantifying individual telomeres is direct hybridization of TTAGGG sequences found on telomeres with fluorescently labeled peptide nucleic acid (PNA) probes. This technique, known as fluorescence in situ hybridization (FISH), can be used to determine telomere length for mid-diffusion because more tandem telomere sequences (i.e., longer telomeres) allow more PNA molecules to bind and therefore brighter "spots" can be seen. To illustrate the application of FISH, the authors performed meta-diffusion of pre-senescent fibroblasts and stained telomere DNA with Alexa Fluor488 in combination with a PNA probe.
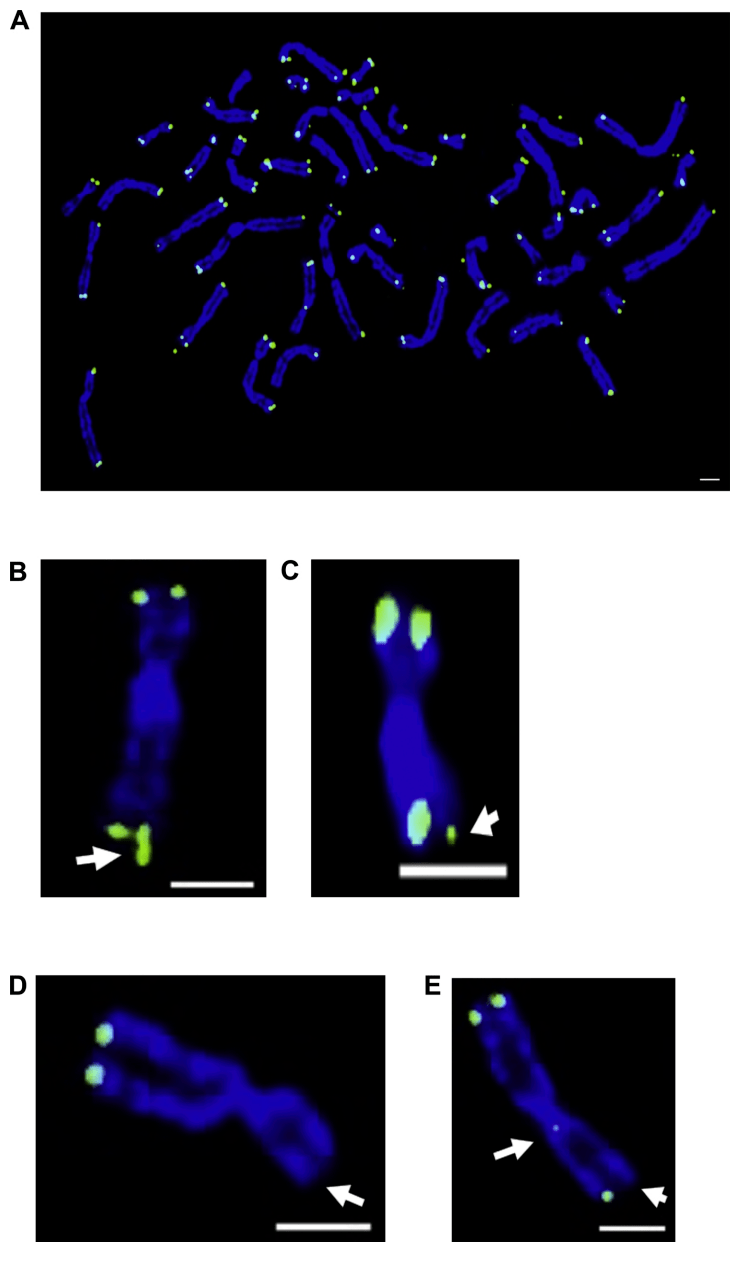
Figure 1: In situ hybridization of telomere fluorescence in senescent fibroblasts, chromosomal aberrations in BJ fibroblasts.
(A) Intermediate diffusion of a pre-aging BJ cell with 46 chromosomes, DNA stained with 4′,6-diamino-2-phenylindole/DAPI (blue) and telomeres with PNA Telc-488 probe (green).
(B) White arrows represent fragile telomeres or telomere diartments
(C) Sister telomere loss results in short telomeres
(D) No signal end on sister chromatids
(E) Loss of interstitial telomere sequence and sister telomeres results in a signal-free end.
The authors looked at the expected 46 chromosomes, most of which contained detectable telomere staining at the ends. The use of FISH for medium-term diffusion is important to identify chromosomal aberrations, including chromosomes containing unsignaled ends. In this case, telomeres that are too short to be recognized by the PNA probe, and fluorescence signals that are too dark to be read by the detector during image acquisition. The presence of unsignaled ends can be estimated, and it is possible to estimate how many very short chromosomes or possibly no telomere DNA may be present.
SIM and STED can improve resolution by controlling the illumination light, and SMLM technology records only a sparse subset of the total number of fluorophores in each image to achieve imaging resolution of 20-50 nanometers. Even if the imaged molecules appear as diffraction restriction points, their exact location can be determined by fitting and centroid lookup as long as they are at least 200 nanometers apart from each other. Super-resolution microscopy and optimized imaging techniques have significantly improved the understanding of telomere biology. Since telomeres have a radius within interphase cells that are lower than diffraction-limited resolution, typically 60-100 nanometers, the use of super-resolution techniques to study the size and shape of telomeres is gaining traction.
Build telomere shapes
Direct stochastic optical reconstruction microscopy (dSTORM) works by "flashing" the fluorescent dye using the temporal separation of individual fluorophores, i.e., recording only emission from sparse sets of individual fluorophores at any one time, and then converting the acquired image sequence into a high-resolution image after fitting and centroid lookup. Usually Alexa Fluor647 (Thermo Fisher Scientificial) is used, which means that a single Alexa Fluor647 molecule undergoes an on-off (light-dark) cycle, with only about 1% of the fluorophore emitting light in each acquisition field of view, stained with the Alexa Fluor647 conjugated PNA probe, immersing the sample in oxygen scavenging buffer to promote light switching and repeating multiple cycles, after acquiring the time series, Gaussian fitting can be used to reconstruct super-resolution images to achieve lateral resolution of 20-30 nanometers.
The super-resolution technique dSTORM was originally used to visualize the acyclic structure of telomeres from different cell types. Early electron microscopy showed that the physical end of telomere DNA folds and replaces a strand of DNA, forming a so-called T-ring structure. Additional studies have shown that this important structure is lost when specific protective proteins are missing, leading to activation of the DNA damage response. These studies show that dSTORM is a very powerful technique that accurately shows the structure of the T-ring.
The authors calculated, reconstructed, and visualized the dSTORM data and found that telomeres were extremely heterogeneous and did not always appear in a spherical structure when analyzing the individual sizes and shapes of point clouds. For example, they may be elongated in one dimension, forming a more oval or rectangular shape, or very irregular. When visualizing individual point clouds in BJ cells in three dimensions, the authors also observed a variety of different shapes. When spherical telomeres are observed, the authors often find irregular isomeric structures, which provide clues to the nature of the telomere region. These images show different three-dimensional arrangements of telomere DNA in BJ fibroblasts, confirming that 3D-STORM is an appropriate technique to study telomere shape.
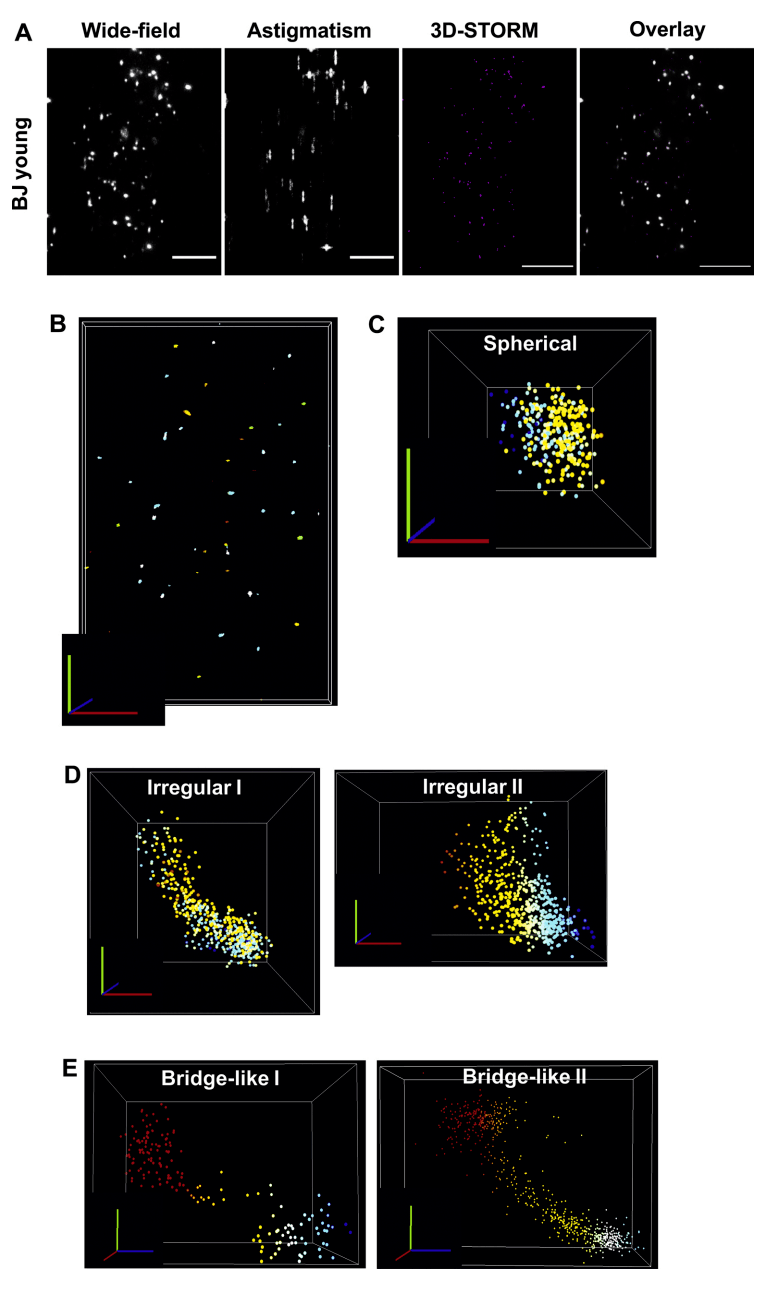
Figure 2: 3D-STORM determines the variability of telomere shape.
(A) An example of a two-dimensional wide-field snapshot, an image astigmatism wide-field snapshot representing 3D, a maximum intensity projection of reconstructed 3D-STORM data, and an overlay image of BJ fibroblasts stained with the PNA TelC-647 probe. Scale bar = 5 μm.
(B) Visualization of individual localizations in NEO SAFe software. Each dot represents a molecule, which is grouped into clusters using DBSCAN. Different colors represent the z-position.
Scale bar = 4 μm, where red = x-axis, green = y-axis, and blue = z-axis. A variety of different shapes are identified, including spherical (C), irregular (D), and bridged structures (E). Ruler bar = 50 nm, where red = x-axis, green = y-axis, and blue = z-axis.
Measure telomere size
Since 3D-STORM has a lateral resolution of 20-30 nanometers and an axial resolution of 50-70 nanometers, it can be used to measure telomere size. According to SMLM imaging, a common reading of telomere size is the radius of rotation, which is the rms distance from each individual molecule to the position of the molecular cloud centroid (centroid). However, the telomere volume, determined by the outermost point of the molecular cloud, can also be used as a readout value for the size. Using these measurements, the team sought to calculate telomere density, or compaction, which represents the amount of telomeric DNA within a certain volume, to explore how telomic DNA is packed. However, the optical switching properties of Alexa Fluor647 allow a single Alexa Fluor647 molecule to be detected multiple times during dSTORM acquisition. So while short telomeres have, on average, fewer switching cycles than long telomeres, and long telomeres contain more PNA probes, one localization does not equal one Alexa Fluor647 molecule. This makes it difficult to extract density measurements based on the number and size of the position. One possibility is to draw the volume based on the number of positioned teomere focal points, with relaxation resulting in more vertical drawn lines. However, if PNA probe hybridization is affected by the dense state of telomeres, its density may be underestimated. Another feature to note is that 3D-STORM has a limited Z-depth, typically around 800-1000 nanometers. Therefore, to cover the entire nucleus, 3D STORM imaging is required in multiple focal planes with refractive index correction. Despite its labor intensity, the technique reveals new interactions between mitochondria and microtubules and may provide more insights into telomere interactions with the nuclear membrane. It is very powerful for the visualization of T-rings and the dimensional measurement of individual short telomeres, beyond what 3D-SIM can achieve.
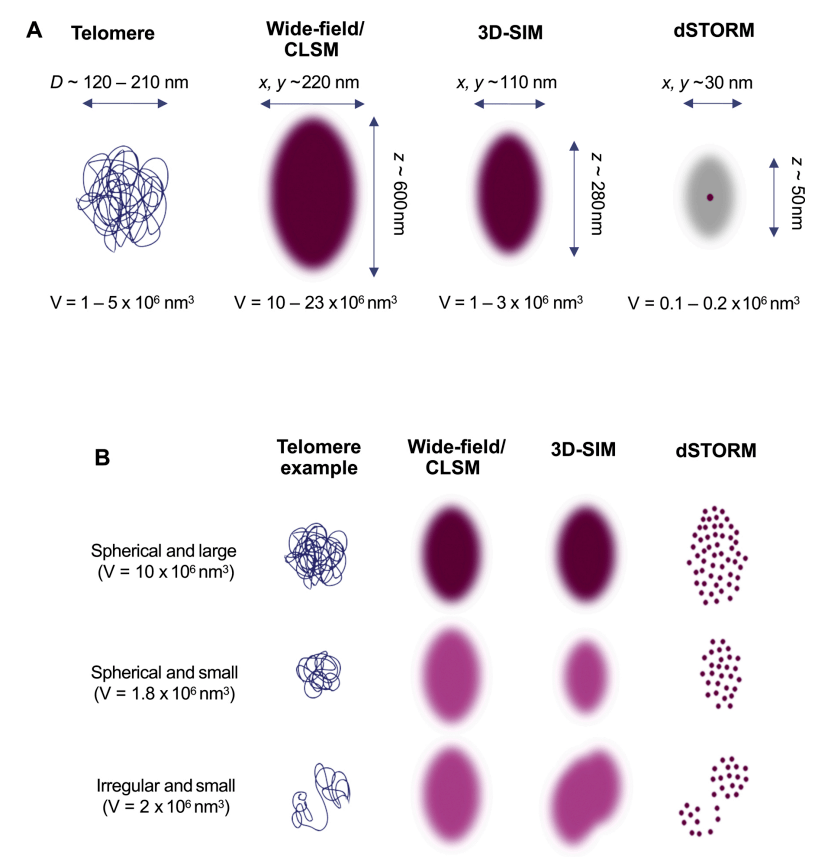
Figure 3: Different methods are used to compare the size of telomeres with the smallest volume that can be resolved by wide field of view, 3D-SIM and dSTORM microscopy techniques.
03 Ultra-high resolution microscopy imaging system iSTORM
Traditional microscopy techniques make it possible to understand the biological basis of telomeres, but nanoscale studies of telomeres do require super-resolution microscopes such as stochastic optical reconstruction microscopes STORM. At present, in China, the random optical reconstruction microscope STORM has been successfully commercialized. The released super-resolution microscopy imaging system iSTORM has successfully achieved a breakthrough in the diffraction limit of optical microscopy, making it possible to engage in single-molecule localization and counting of biological macromolecules, subcellular and supramolecular structure analysis, biodynamics of biological macromolecules and other research on the resolution scale of 20 nanometers, thus bringing major breakthroughs to life sciences, medicine and other fields.
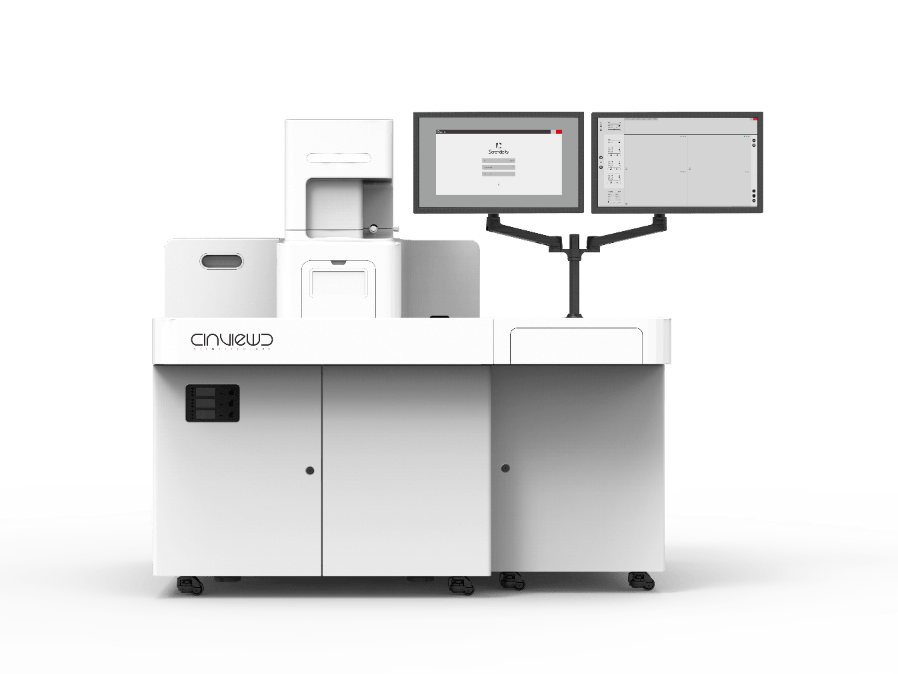
The ultra-high resolution microscopy imaging system iSTORM has the characteristics of 20nm ultra-high resolution, 3-channel simultaneous imaging, 3D simultaneous shooting, real-time reconstruction, 2-hour novice mastery, etc., and provides fluorescent dye selection, sample preparation, imaging services and experimental solutions as an overall solution, which has been highly recognized for its excellent characteristics such as nanoscale observation accuracy, high stability, wide environmental applicability, fast imaging, and simple operation!
References
Adam N, Beattie TL, Riabowol K. Fluorescence microscopy methods for examining telomeres during cell aging. Ageing Res Rev. 2021 Jul;68:101320. doi: 10.1016/j.arr.2021.101320. Epub 2021 Mar 17. PMID: 33744488.